今天排查了个内存申请率较高的问题,单个节点上 Allocation Rate 为 700MB/s,Promoted Rate 仅 300KB/s,而通过查看该组应用的历史监控,发现 Allocation Rate 之前从未超过 200MB/s。自最近一个版本发布后,Allocation Rate 翻了几倍,通过 async-profiler 对内存申请进行分析发现为业务中一段类型转换的代码导致,即 String.valueOf(long l) 方法,最后通过优化业务代码实现解决该问题。
2022-09-20
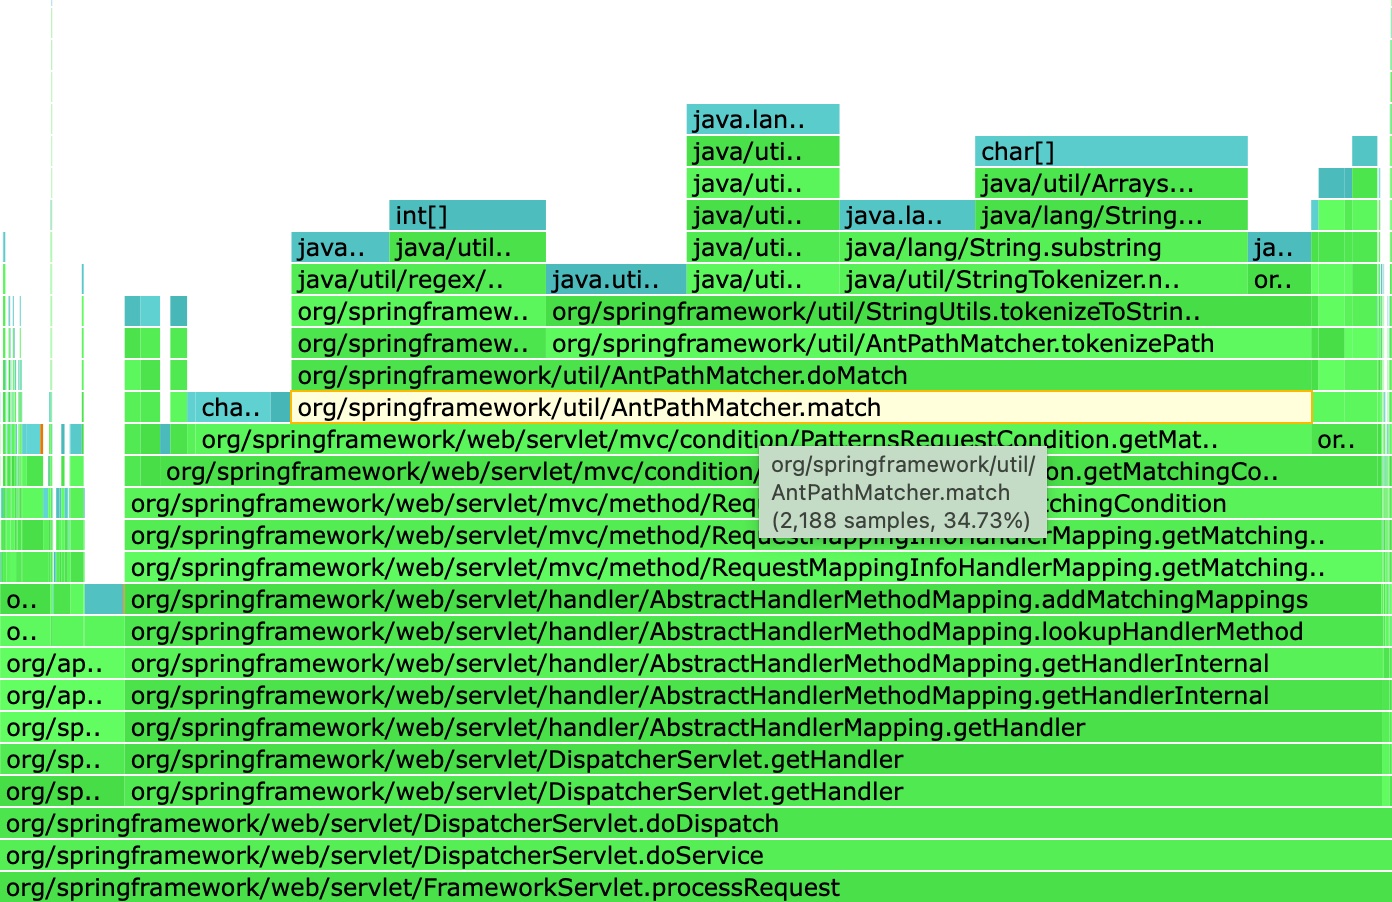
类似地,今天查了个由业务中滥用 RequestMapping 中的正则匹配导致内存申请率高的问题,此时不能直接通过请求的 URL 直接查询出关联的 HandlerMethod,而需要遍历所有的 mapping 去尝试正则匹配,导致内存申请率高,相关源码位于 AbstractHandlerMethodMapping.java at v3.2.18:
1 | /** |
getMatchingMapping 将调用至 AntPathMatcher#match,该方法执行过程中需要执行正则匹配,消耗 CPU 的同时还需大量申请内存,导致 GC 压力增大,关于这部分的 Profile 图表如下:
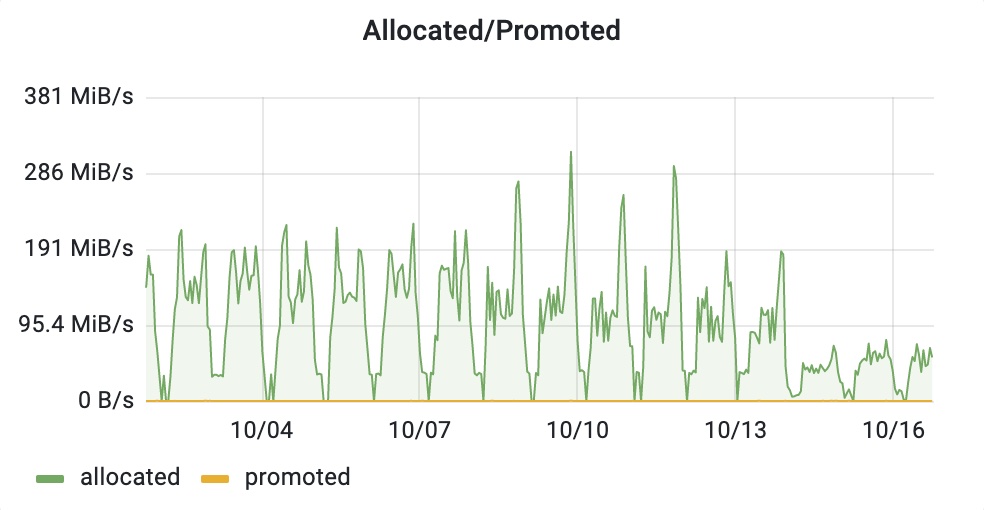
在我们的业务场景下,实际上是可以显式指定 path 的,所以我们通过将匹配声明为明确的 path 解决了该问题,2020-10-14 优化版本上线后内存申请率下降了三四倍:
关于 AntPathMatcher 的性能问题,社区也有讨论,可参考以下相关链接:
- Avoid using Regex for matching URL paths when possible as doing so causes more of the request time to be spent in regex then doing the API call itself. · Issue #24873 · spring-projects/spring-framework · GitHub
- Support for PathPatternParser in Spring MVC · Issue #24945 · spring-projects/spring-framework · GitHub
- URL Matching with PathPattern in Spring MVC
- Add option to configure PathPatternParser in Spring MVC · Issue #21694 · spring-projects/spring-boot · GitHub
即引入 Spring WebFlux 中使用的 PathPatternParser 来解决 AntPathMatcher 当前的性能问题。
References
High Allocation Rate | Plumbr – User Experience & Application Performance Monitoring
GitHub - jvm-profiling-tools/async-profiler: Sampling CPU and HEAP profiler for Java featuring AsyncGetCallTrace + perf_events