Poison

com.sun.management.OperatingSystemMXBean.getSystemCpuLoad()

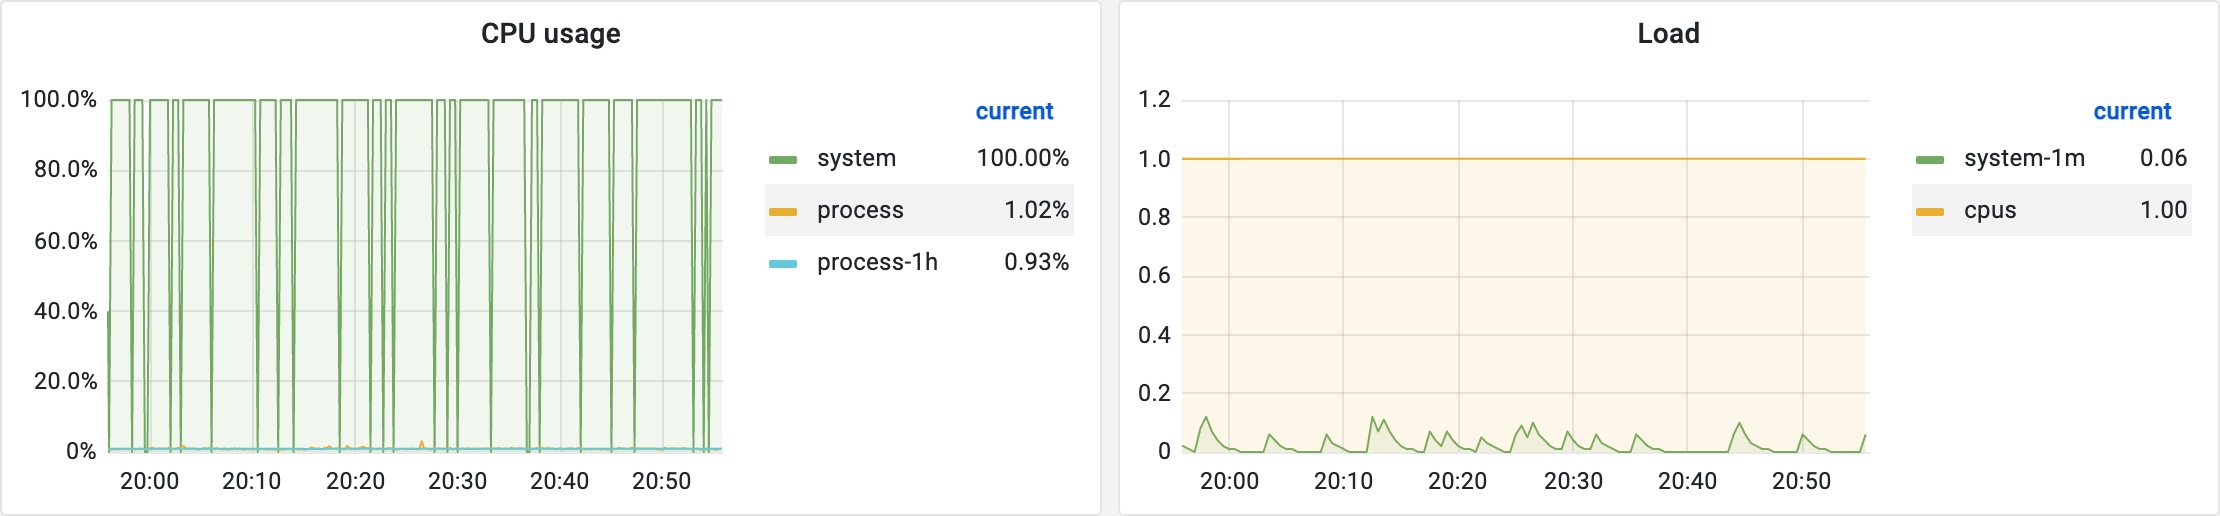
我们发现在部分实例上采集的 CPU 使用率明显不正确,出问题时采集到的值总是高于实际值,进入实例通过 top 等命令确认 CPU 使用率并不高,且有时重启应用后采集的 CPU 使用率又会正常,再次重启后可能又不正常,其中一台单核 CPU 实例的 CPU 使用率不正常时的 Grafana 监控图表如下图所示:


在我们的 Java Agent 中,CPU 使用率是通过 micrometer 中的 ProcessorMetrics.java at v1.7.1 发起采集的,其源码如下:

1
2
3
4
5
6
7
8
9
10
11
12
13
14
15
16
17
18
19
20
21
22
23
24
25
26
27
28
29
30
31
32
33
34
35
36
37
38
39
40
41
42
43
44
45
46
47
48
49
50
51
52
53
54
55
56
57
58
59
60
61
62
63
64
65
66
67
68
69
70
71
72
73
74
75
76
77
78
79
80
81
82
83
84
85
86
87
88
89
90
91
92
93
94
95
96
97
98
99
100
101
102
103
104
105
106
107
108
109
110
111
112
113
114
115
/**
* Record metrics related to the CPU, gathered by the JVM.
* <p>
* Supported JVM implementations:
* <ul>
* <li>HotSpot</li>
* <li>J9</li>
* </ul>
*
* @author Jon Schneider
* @author Michael Weirauch
* @author Clint Checketts
* @author Tommy Ludwig
*/
@NonNullApi
@NonNullFields
public class ProcessorMetrics implements MeterBinder {

/** List of public, exported interface class names from supported JVM implementations. */
private static final List<String> OPERATING_SYSTEM_BEAN_CLASS_NAMES = Arrays.asList(
"com.ibm.lang.management.OperatingSystemMXBean", // J9
"com.sun.management.OperatingSystemMXBean" // HotSpot
);

private final Iterable<Tag> tags;

private final OperatingSystemMXBean operatingSystemBean;

@Nullable
private final Class<?> operatingSystemBeanClass;

@Nullable
private final Method systemCpuUsage;

@Nullable
private final Method processCpuUsage;

public ProcessorMetrics() {
this(emptyList());
}

public ProcessorMetrics(Iterable<Tag> tags) {
this.tags = tags;
this.operatingSystemBean = ManagementFactory.getOperatingSystemMXBean();
this.operatingSystemBeanClass = getFirstClassFound(OPERATING_SYSTEM_BEAN_CLASS_NAMES);
Method getCpuLoad = detectMethod("getCpuLoad");
this.systemCpuUsage = getCpuLoad != null ? getCpuLoad : detectMethod("getSystemCpuLoad");
this.processCpuUsage = detectMethod("getProcessCpuLoad");
}

@Override
public void bindTo(MeterRegistry registry) {
Runtime runtime = Runtime.getRuntime();
Gauge.builder("system.cpu.count", runtime, Runtime::availableProcessors)
.tags(tags)
.description("The number of processors available to the Java virtual machine")
.register(registry);

if (operatingSystemBean.getSystemLoadAverage() >= 0) {
Gauge.builder("system.load.average.1m", operatingSystemBean, OperatingSystemMXBean::getSystemLoadAverage)
.tags(tags)
.description("The sum of the number of runnable entities queued to available processors and the number " +
"of runnable entities running on the available processors averaged over a period of time")
.register(registry);
}

if (systemCpuUsage != null) {
Gauge.builder("system.cpu.usage", operatingSystemBean, x -> invoke(systemCpuUsage))
.tags(tags)
.description("The \"recent cpu usage\" for the whole system")
.register(registry);
}

if (processCpuUsage != null) {
Gauge.builder("process.cpu.usage", operatingSystemBean, x -> invoke(processCpuUsage))
.tags(tags)
.description("The \"recent cpu usage\" for the Java Virtual Machine process")
.register(registry);
}
}

private double invoke(@Nullable Method method) {
try {
return method != null ? (double) method.invoke(operatingSystemBean) : Double.NaN;
} catch (IllegalAccessException | IllegalArgumentException | InvocationTargetException e) {
return Double.NaN;
}
}

@Nullable
private Method detectMethod(String name) {
requireNonNull(name);
if (operatingSystemBeanClass == null) {
return null;
}
try {
// ensure the Bean we have is actually an instance of the interface
operatingSystemBeanClass.cast(operatingSystemBean);
return operatingSystemBeanClass.getDeclaredMethod(name);
} catch (ClassCastException | NoSuchMethodException | SecurityException e) {
return null;
}
}

@Nullable
private Class<?> getFirstClassFound(List<String> classNames) {
for (String className : classNames) {
try {
return Class.forName(className);
} catch (ClassNotFoundException ignore) {
}
}
return null;
}
}

可以看出其实现相当简单,即找出对应 JVM 实现中的方法,然后通过反射获取相关指标值。对于我们的 Oracle JDK,其最终使用的 com.sun.management.OperatingSystemMXBean.getSystemCpuLoad() 方法进行系统 CPU 使用率采集,而为何在部分实例上采集出的值总是显著高于实际值呢?由于该方法是 native 方法,于是我查看了其对应的 c 源码,源码位于 LinuxOperatingSystem.c at jdk8-b120,代码实现并不复杂,主要为计算两次采集时刻滴答数之差的比值,其中令我不解的是这段代码:

1
2
3
4
5
6
7
8
9
10
11
12
13
14
15
16
17
18
19
20
21
22
23
24
25
26
27
28
29
30
/**
* This method must be called first, before any data can be gathererd.
*/
int perfInit() {
static int initialized=1;

if (!initialized) {
int i;

int n = sysconf(_SC_NPROCESSORS_ONLN);
if (n <= 0) {
n = 1;
}

counters.cpus = calloc(n,sizeof(ticks));
if (counters.cpus != NULL) {
// For the CPU load
get_totalticks(-1, &counters.cpuTicks);

for (i = 0; i < n; i++) {
get_totalticks(i, &counters.cpus[i]);
}
// For JVM load
get_jvmticks(&counters.jvmTicks);
initialized = 1;
}
}

return initialized ? 0 : -1;
}

其中 if 块中的代码能得到执行吗?因为对 c 语言不是很熟悉,所以我写了一段如下的测试代码:

1
2
3
4
5
6
7
8
9
10
11
12
#include <stdio.h>

int main() {
printf("Hello world");

static int initialized=1;
if (!initialized) {
printf("I'm in");
}

return 0;
}

通过 Online C Compiler 执行确认不会进入 if 块。于是我在邮件列表咨询了该问题,通过 About the perfInit() method in LinuxOperatingSystem.c 确认该段代码已经在 JDK-8226575 OperatingSystemMXBean should be made container aware - Java Bug System 中被顺便修复了,提交的代码位于 8226575: OperatingSystemMXBean should be made container aware · openjdk/jdk8u@2ae9483 · GitHub,且已经被反向移植到 Oracle JDK 8u261。而我开始看的代码是看的 jdk8 的,并不是修复了补丁的版本,带有补丁的版本为 jdk8u,源码仓库位于:GitHub - openjdk/jdk8u,关于 jdk8jdk8u 的区别可以参考:What version of openjdk8’s source do I get to build update 131, same as oracle’s latest? jdk8/jdk8u? - Stack Overflow

回到我们之前的问题,修复了初始化逻辑未执行的代码被反向移植到了 Oracle JDK 8u261,而我们应用所使用的 Oracle JDK 版本为 8u211,为了排除该段代码未执行带来的潜在影响,我将 JDK 版本升级至了 8u291,升级后出现了个小插曲,部分应用的 HTTPS 请求发生异常,原来应用中还存在 TLS 1.0TLS 1.1 的使用,而 8u291 默认已经禁用了 TLS 1.0TLS 1.1,更新说明可以参考 Java™ SE Development Kit 8, Update 291 Release Notes,为了保证兼容性,当时在设置中取消了对低版本 TLS 的禁用以保证业务可用。但是升级了 JDK 版本发布后发现问题依然存在,部分实例采集的 CPU 使用率高于实际值,到底是什么原因导致的呢?因为 JDK-8226575 对 OperatingSystemMXBean 新增了容器感知的能力,而我们的应用也确实运行于 Docker 容器中,虽然应用运行于 Docker 容器中,但是我们并未设置过 CPU 配额等相关参数,理论上不会执行容器指标探测的相关逻辑,首先我们可以确认升级至 Oracle JDK 8u291 后的 getSystemCpuLoad() 方法源码位于 jdk8u/OperatingSystemImpl.java at jdk8u292-b00:

1
2
3
4
5
6
7
8
9
10
11
12
13
14
15
16
17
18
19
20
21
22
23
24
25
26
27
28
29
30
31
32
33
34
35
36
37
38
39
40
41
42
public double getSystemCpuLoad() {
if (containerMetrics != null) {
long quota = containerMetrics.getCpuQuota();
if (quota > 0) {
long periodLength = containerMetrics.getCpuPeriod();
long numPeriods = containerMetrics.getCpuNumPeriods();
long usageNanos = containerMetrics.getCpuUsage();
if (periodLength > 0 && numPeriods > 0 && usageNanos > 0) {
long elapsedNanos = TimeUnit.MICROSECONDS.toNanos(periodLength * numPeriods);
double systemLoad = (double) usageNanos / elapsedNanos;
// Ensure the return value is in the range 0.0 -> 1.0
systemLoad = Math.max(0.0, systemLoad);
systemLoad = Math.min(1.0, systemLoad);
return systemLoad;
}
return -1;
} else {
// If CPU quotas are not active then find the average system load for
// all online CPUs that are allowed to run this container.

// If the cpuset is the same as the host's one there is no need to iterate over each CPU
if (isCpuSetSameAsHostCpuSet()) {
return getSystemCpuLoad0();
} else {
int[] cpuSet = containerMetrics.getEffectiveCpuSetCpus();
if (cpuSet != null && cpuSet.length > 0) {
double systemLoad = 0.0;
for (int cpu : cpuSet) {
double cpuLoad = getSingleCpuLoad0(cpu);
if (cpuLoad < 0) {
return -1;
}
systemLoad += cpuLoad;
}
return systemLoad / cpuSet.length;
}
return -1;
}
}
}
return getSystemCpuLoad0();
}

为了确认该方法内部的执行路径,我用 arthas 对该方法进行了 trace,明确执行路径为:

1
2
3
4
5
`---ts=2022-02-18 17:18:23;thread_name=Thread-3;id=10;is_daemon=false;priority=5;TCCL=me.tianshuang.agent.bootstrap.MonitorAgentClassLoader@14ae5a5
`---[0.232565ms] sun.management.OperatingSystemImpl:getSystemCpuLoad()
+---[0.054435ms] jdk.internal.platform.Metrics:getCpuQuota() #135
+---[0.044584ms] sun.management.OperatingSystemImpl:isCpuSetSameAsHostCpuSet() #154
`---[0.074394ms] sun.management.OperatingSystemImpl:getSystemCpuLoad0() #155

可知,最后依然走的 nativegetSystemCpuLoad0() 方法进行 CPU 使用率获取。为了明确异常的值是否真正来源于 nativegetSystemCpuLoad0() 方法,我用 watch 命令进行了观察,其返回数据如下:

1
2
3
4
5
6
7
8
9
10
11
12
13
14
15
16
17
18
19
20
21
22
23
24
25
Affect(class count: 1 , method count: 1) cost in 148 ms, listenerId: 16
method=sun.management.OperatingSystemImpl.getSystemCpuLoad location=AtExit
ts=2022-02-18 17:25:03; [cost=0.265914ms] result=@ArrayList[
@Object[][isEmpty=true;size=0],
@Double[0.05177664974619289],
null,
]
method=sun.management.OperatingSystemImpl.getSystemCpuLoad location=AtExit
ts=2022-02-18 17:25:03; [cost=0.167474ms] result=@ArrayList[
@Object[][isEmpty=true;size=0],
@Double[1.0],
null,
]
method=sun.management.OperatingSystemImpl.getSystemCpuLoad location=AtExit
ts=2022-02-18 17:25:13; [cost=0.128953ms] result=@ArrayList[
@Object[][isEmpty=true;size=0],
@Double[0.02845528455284553],
null,
]
method=sun.management.OperatingSystemImpl.getSystemCpuLoad location=AtExit
ts=2022-02-18 17:25:13; [cost=0.159285ms] result=@ArrayList[
@Object[][isEmpty=true;size=0],
@Double[1.0],
null,
]

到此处就发现 1.0 这个数据确实是源于 nativegetSystemCpuLoad0() 方法,而同时观察上面的输出,可以发现一个问题,即每个时刻采集了两次 CPU,每轮采集时间相隔 10s,而这 10s 确实是我们 Prometheus 配置的采集间隔。那么现在问题变为了为何一个时刻采集了两次,且第二次采集的 CPU 使用率为 1.0 呢?我首先怀疑了 Prometheus 的配置问题,在检查配置无误后,通过搜索发现了这个 issue: Target Scraped Twice Race Condition - Possibly Due to Reload · Issue #6894 · prometheus/prometheus · GitHub,该问题和我们遇到的有类似之处,因为我们也用到了运行时重新加载 Prometheus 配置的特性,为了排除运行时重新加载配置的影响,我先关闭掉了重新加载配置的相关逻辑,然后重启了 Prometheus,发现问题依旧。于是我尝试在本地复现该问题,在本地编写代码并附着用于监控的 Java Agent 启动后在 getSystemCpuLoad() 方法上增加断点,通过手动触发指标抓取,发现另一个采集由 jmx_exporter/JmxCollector.java at parent-0.16.0 发起,而根据我们 JMX Exporter 配置文件,其中与操作系统指标采集有关的配置如下:

1
2
3
4
- pattern: 'java.lang<type=OperatingSystem><>(TotalSwapSpaceSize):'
name: operating_system_$1
help: Operating system $1
type: GAUGE

而为何会触发对系统 CPU 使用率的采集呢,于是我查看了 JmxCollector 的相关源码,发现默认会对所有 mBeans 进行采集,关于该逻辑在其官方文档中也有说明,配置说明可以参考:GitHub - prometheus/jmx_exporter: A process for exposing JMX Beans via HTTP for Prometheus consumption,其中对 whitelistObjectNames 属性的说明为:A list of ObjectNames to query. Defaults to all mBeans.。对应的源码实现位于jmx_exporter/JmxCollector.java at parent-0.16.0:

1
2
3
4
5
6
7
8
if (yamlConfig.containsKey("whitelistObjectNames")) {
List<Object> names = (List<Object>) yamlConfig.get("whitelistObjectNames");
for(Object name : names) {
cfg.whitelistObjectNames.add(new ObjectName((String)name));
}
} else {
cfg.whitelistObjectNames.add(null);
}

对所有 mBean 进行采集的源码位于 jmx_exporter/JmxScraper.java at parent-0.16.0:

1
2
3
4
5
6
7
8
9
10
11
12
13
14
15
16
17
18
19
20
21
Set<ObjectName> mBeanNames = new HashSet<ObjectName>();
for (ObjectName name : whitelistObjectNames) {
for (ObjectInstance instance : beanConn.queryMBeans(name, null)) {
mBeanNames.add(instance.getObjectName());
}
}

for (ObjectName name : blacklistObjectNames) {
for (ObjectInstance instance : beanConn.queryMBeans(name, null)) {
mBeanNames.remove(instance.getObjectName());
}
}

// Now that we have *only* the whitelisted mBeans, remove any old ones from the cache:
jmxMBeanPropertyCache.onlyKeepMBeans(mBeanNames);

for (ObjectName objectName : mBeanNames) {
long start = System.nanoTime();
scrapeBean(beanConn, objectName);
logger.fine("TIME: " + (System.nanoTime() - start) + " ns for " + objectName.toString());
}

通过以上代码可知会对所有 mBean 进行采集,在 scrapeBean(beanConn, objectName) 方法实现中,会对每个 mBean 的所有属性进行采集,而后再根据配置文件中的 pattern 进行过滤以决定是否保留指标。对应我们的配置文件,即会将名为 java.lang:type=OperatingSystemmBean 的所有属性进行采集,然后再过滤出所需的指标,即使我们配置的仅需要 TotalSwapSpaceSize 这一个属性,也会触发 SystemCpuLoad 这一属性的采集。到这里,我们已经明确两次采集的缘由,那么如何解释第二次采集结果为 1.0 这个问题呢?继续查阅数据采集的相关源码,可知,核心的抓取逻辑位于 micrometer/PrometheusMeterRegistry.java at v1.7.1:

1
2
3
4
5
6
7
8
9
10
11
12
13
14
private final CollectorRegistry registry;

/**
* Write the metrics scrape body in a specific content type to the given writer.
*
* @param writer where to write the scrape body
* @param contentType the Content-Type of the scrape
* @throws IOException if writing fails
* @see TextFormat
* @since 1.7.0
*/
public void scrape(Writer writer, String contentType) throws IOException {
scrape(writer, contentType, registry.metricFamilySamples());
}

其中 registry.metricFamilySamples() 方法实现位于 client_java/CollectorRegistry.java at parent-0.11.0:

1
2
3
4
5
6
/**
* Enumeration of metrics of all registered collectors.
*/
public Enumeration<Collector.MetricFamilySamples> metricFamilySamples() {
return new MetricFamilySamplesEnumeration();
}

当看到 client_java/CollectorRegistry.java at parent-0.11.0 的源码时,我已经猜测到了 CPU 使用率时好时坏的原因了,在文首我们提到,当应用 CPU 使用率明显不正常时,如果我们重启应用,采集的 CPU 使用率有时会恢复正常,如果我们继续重启应用,采集的 CPU 使用率有时又会变为不正常。那么这是什么原因导致的呢?根据 CollectorRegistry 类的源码我们知道所有的采集器注册到了 collectorsToNames 这个 HashMap 中,源码如下:

1
private final Map<Collector, List<String>> collectorsToNames = new HashMap<Collector, List<String>>();

发起采集时根据该 HashMapkeySet 集合创建了一个包含所有收集器的 HashSet,然后使用该 HashSet 的迭代器对所有的收集器依次发起采集,创建 HaseSet 的源码如下:

1
2
3
4
5
6
7
8
/**
* A snapshot of the current collectors.
*/
private Set<Collector> collectors() {
synchronized (namesCollectorsLock) {
return new HashSet<Collector>(collectorsToNames.keySet());
}
}

然后在刚刚提到的 MetricFamilySamplesEnumeration 类的实例中对所有收集器发起采集:

1
2
3
4
5
6
7
8
9
10
11
12
13
14
15
16
17
18
19
20
21
22
23
24
25
26
27
28
29
30
31
32
33
34
35
36
37
38
39
40
41
42
43
44
45
46
47
48
49
50
51
52
53
54
55
56
57
class MetricFamilySamplesEnumeration implements Enumeration<Collector.MetricFamilySamples> {

private final Iterator<Collector> collectorIter;
private Iterator<Collector.MetricFamilySamples> metricFamilySamples;
private Collector.MetricFamilySamples next;
private Set<String> includedNames;

MetricFamilySamplesEnumeration(Set<String> includedNames) {
this.includedNames = includedNames;
collectorIter = includedCollectorIterator(includedNames);
findNextElement();
}

private Iterator<Collector> includedCollectorIterator(Set<String> includedNames) {
if (includedNames.isEmpty()) {
return collectors().iterator();
} else {
HashSet<Collector> collectors = new HashSet<Collector>();
synchronized (namesCollectorsLock) {
for (Map.Entry<String, Collector> entry : namesToCollectors.entrySet()) {
if (includedNames.contains(entry.getKey())) {
collectors.add(entry.getValue());
}
}
}

return collectors.iterator();
}
}

MetricFamilySamplesEnumeration() {
this(Collections.<String>emptySet());
}

private void findNextElement() {
next = null;

while (metricFamilySamples != null && metricFamilySamples.hasNext()) {
next = filter(metricFamilySamples.next());
if (next != null) {
return;
}
}

if (next == null) {
while (collectorIter.hasNext()) {
metricFamilySamples = collectorIter.next().collect().iterator();
while (metricFamilySamples.hasNext()) {
next = filter(metricFamilySamples.next());
if (next != null) {
return;
}
}
}
}
}
}

以上第 47 行会触发收集器的 collect() 方法进行指标采集,看到这里我们就知道 CPU 使用率有时重启应用后正常,有时重启后又不正常的原因了。因为其中存储所有 Collector 使用的数据结构为 HashMap 且用到的 Collector 类均未实现 hashCode() 方法,micrometer/MicrometerCollector.java at v1.7.1jmx_exporter/JmxCollector.java 未实现 hashCode() 方法,它们的父类 client_java/Collector.java at parent-0.11.0 也未实现 hashCode() 方法,那么此种场景下,调用 hashCode() 方法将会使用 Object 中的默认实现,其原理可以参考 System.identityHashCode() 一文中的分析。到此处,我们知道每次应用启动向 CollectorRegistry 注册收集器时,由于不同的 JVM 实例不保证同一个对象实例的 hashCode() 返回值相同,那么 MicrometerCollector 实例与 JmxCollector 实例在 HashMap 中的分布顺序就不能保证相同,当然,在应用启动后的本次 JVM 生命周期之中,相同实例的 hashCode() 返回值肯定是相同的。而 HashSet 的迭代器本质上使用的底层的 HashMapkeySet() 返回的迭代器,其源码位于 HashMap.java at jdk8-b120:

1
2
3
4
5
6
7
8
9
10
11
12
13
14
15
16
17
18
19
20
21
22
23
24
25
26
27
28
29
30
31
32
33
34
35
36
37
38
39
40
41
42
43
44
45
abstract class HashIterator {
Node<K,V> next; // next entry to return
Node<K,V> current; // current entry
int expectedModCount; // for fast-fail
int index; // current slot

HashIterator() {
expectedModCount = modCount;
Node<K,V>[] t = table;
current = next = null;
index = 0;
if (t != null && size > 0) { // advance to first entry
do {} while (index < t.length && (next = t[index++]) == null);
}
}

public final boolean hasNext() {
return next != null;
}

final Node<K,V> nextNode() {
Node<K,V>[] t;
Node<K,V> e = next;
if (modCount != expectedModCount)
throw new ConcurrentModificationException();
if (e == null)
throw new NoSuchElementException();
if ((next = (current = e).next) == null && (t = table) != null) {
do {} while (index < t.length && (next = t[index++]) == null);
}
return e;
}

public final void remove() {
Node<K,V> p = current;
if (p == null)
throw new IllegalStateException();
if (modCount != expectedModCount)
throw new ConcurrentModificationException();
current = null;
K key = p.key;
removeNode(hash(key), key, null, false, false);
expectedModCount = modCount;
}
}

可以看出迭代时本质上是通过遍历底层 Node 数组完成,如果我们用于采集系统 CPU 使用率的 MicrometerCollector 实例在数组中顺序在 JmxCollector 实例之前,那么用于采集系统 CPU 使用率的 MicrometerCollector 实例采集到的数据就会正常,因为自上次采集已经过去接近 10s,本次采集到的值反应的 10s 内的平均 CPU 使用率,而如果用于采集系统 CPU 使用率的 MicrometerCollector 实例在数组中顺序在 JmxCollector 实例之后,那么用于采集系统 CPU 使用率的 MicrometerCollector 实例采集到的 CPU 使用率其实是自 JmxCollector 采集 CPU 使用率后这一段微小时间间隔内的 CPU 使用率,可以理解为此时采集到了一个瞬时 CPU 使用率,而在这段微小的时间间隔内,还执行了其他收集器的相关操作,具体直接执行了多少采集操作,取决于 MicrometerCollector 实例与 JmxCollector 实例在 Node 数组中之间存在多少个收集器。具体的 CPU 使用率计算逻辑可以结合 jdk8u/LinuxOperatingSystem.c at jdk8u292-b00 理解。

我在一台系统 CPU 使用率采集值不正确的实例上拉取了堆转储验证了用于采集系统 CPU 使用率的 MicrometerCollector 实例与 JmxCollector 实例在 HashMap 中的分布情况,如图:


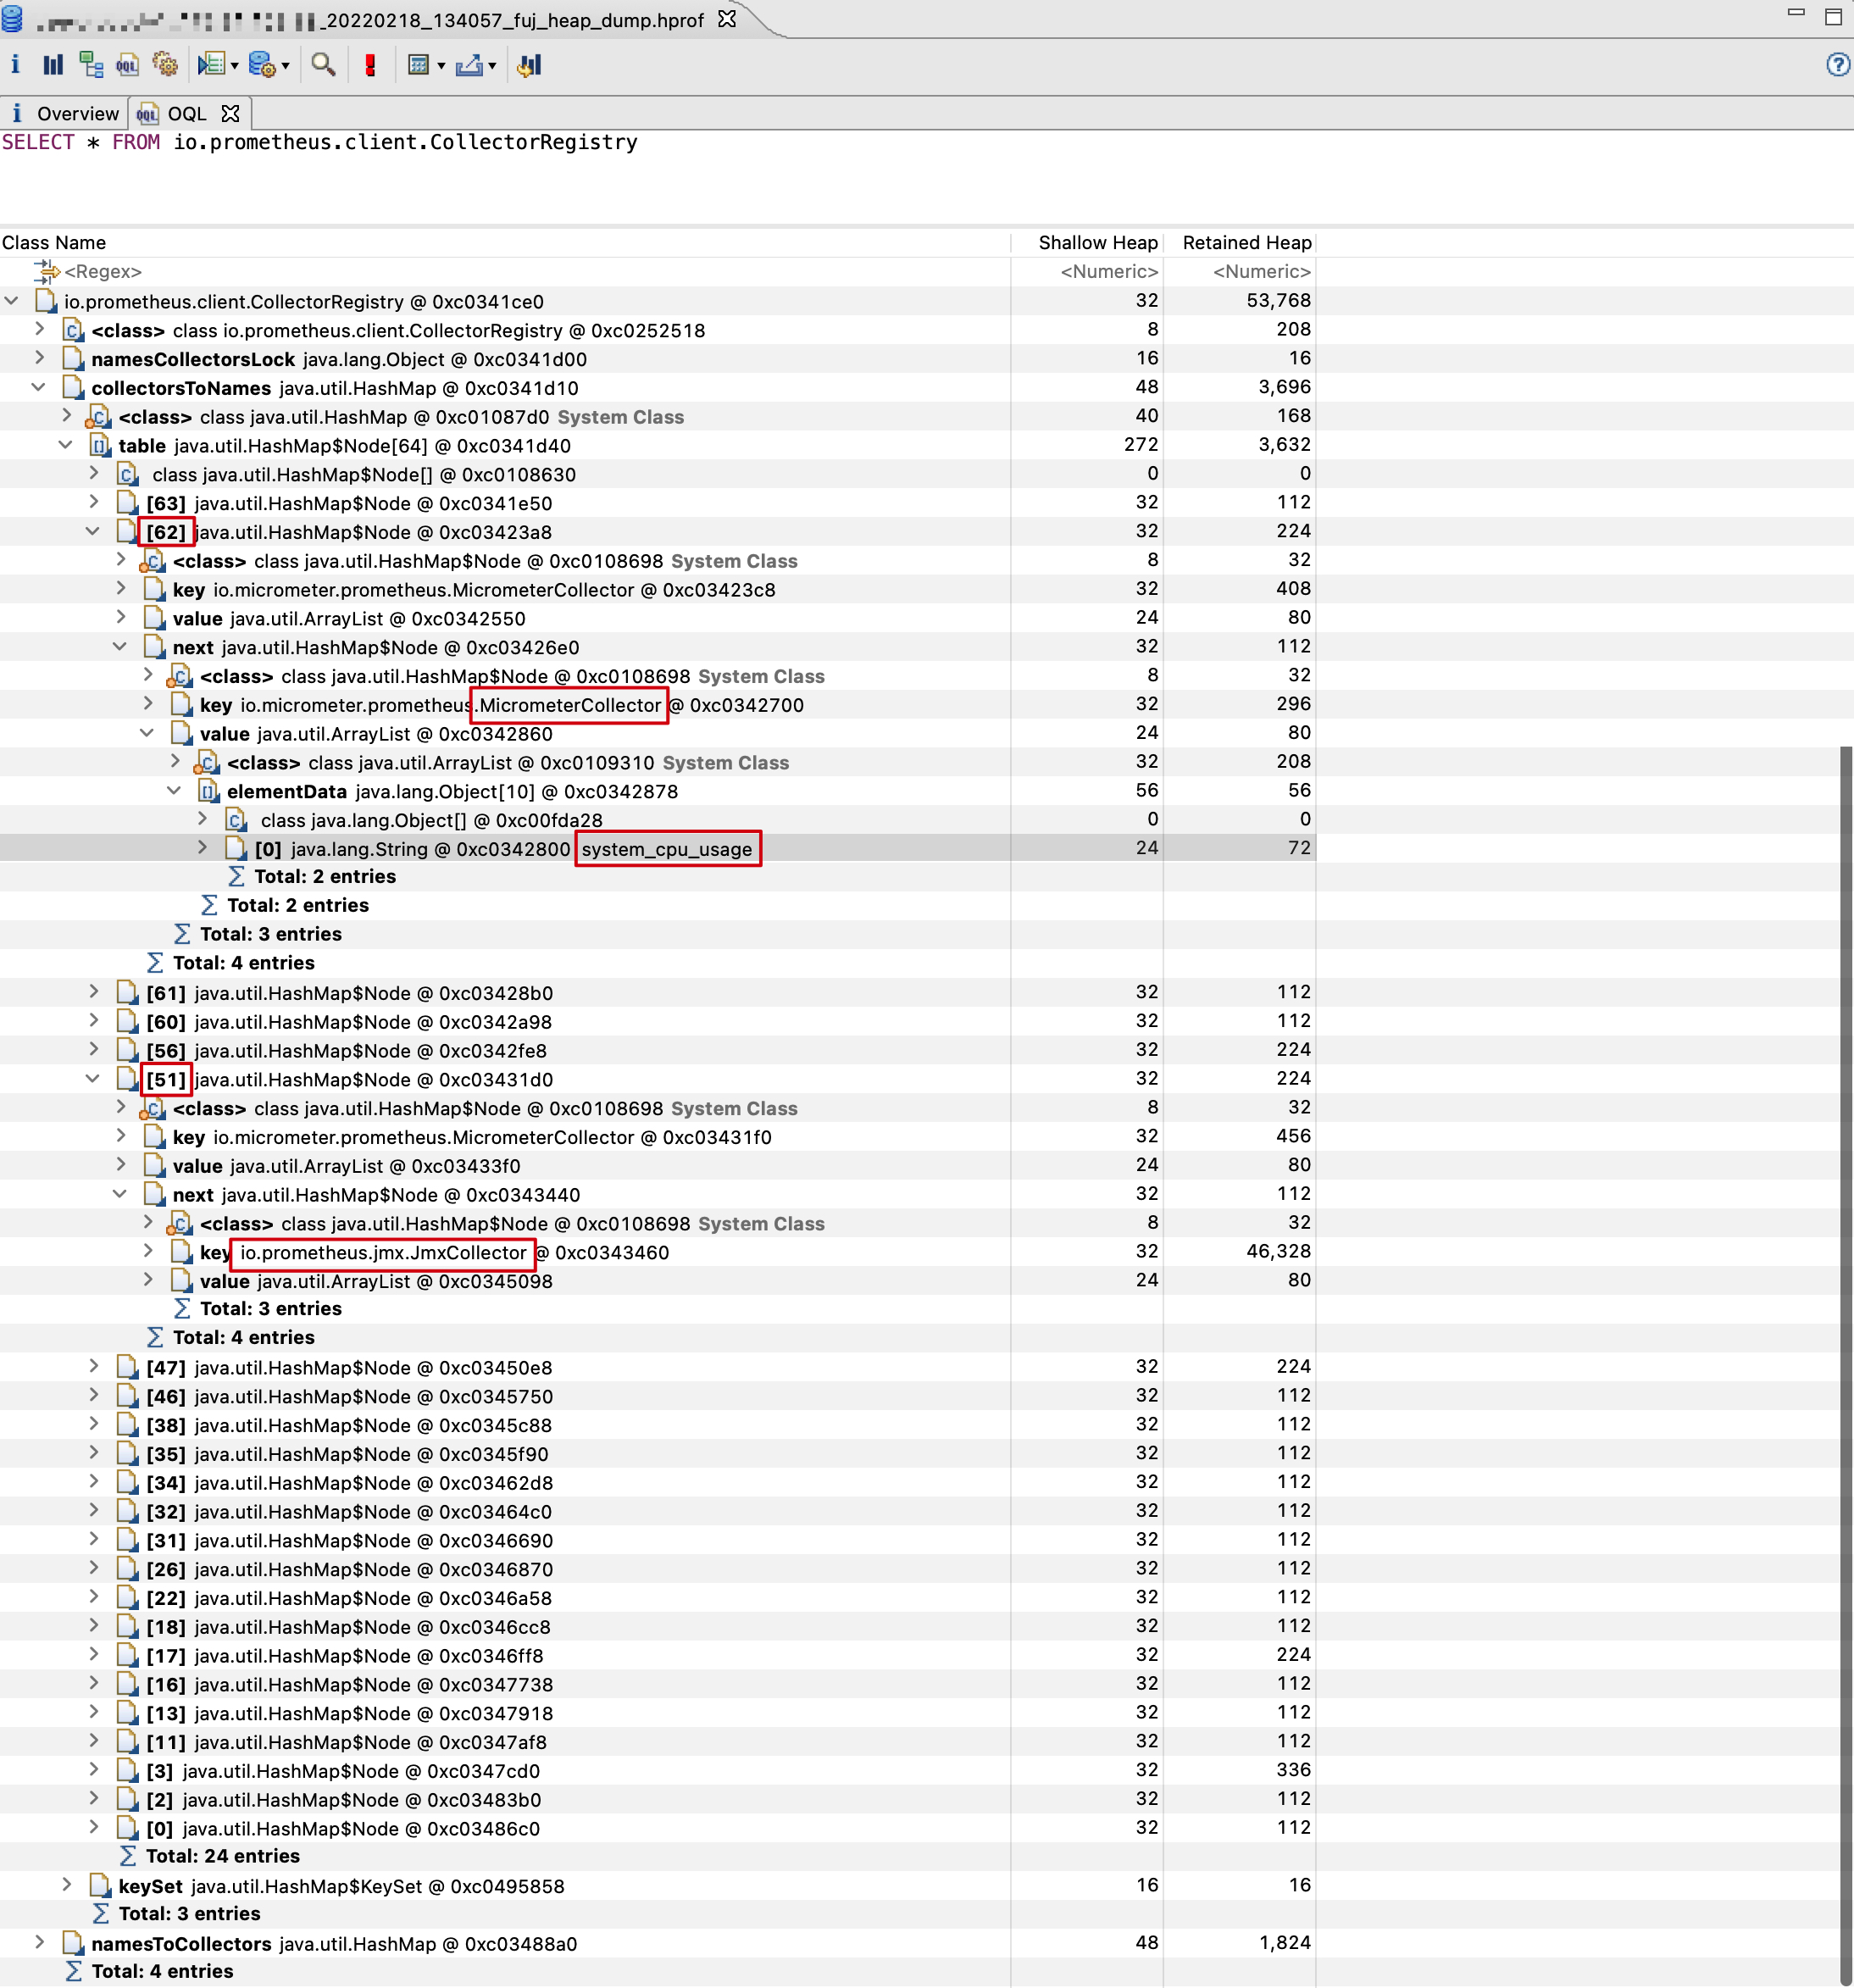
可以看出,此时我们用于采集系统 CPU 使用率的 MicrometerCollector 实例在 HashMap 中的分布位于 JmxCollector 之后,即验证了我们的设想。我们可以写段简单的代码来复现以上的采集问题,代码如下:

1
2
3
4
5
6
7
8
9
10
11
12
13
14
15
16
17
18
19
20
21
22
23
24
25
26
27
28
29
30
31
import java.lang.management.ManagementFactory;
import java.lang.management.OperatingSystemMXBean;
import java.time.LocalDateTime;

public class Test {

public static void main(String[] args) throws InterruptedException {
com.sun.management.OperatingSystemMXBean operatingSystemMXBean = ((com.sun.management.OperatingSystemMXBean) ManagementFactory.getPlatformMXBean(OperatingSystemMXBean.class));

Thread thread = new Thread(() -> {
while (true) {
try {
Thread.sleep(10 * 1000L);
} catch (InterruptedException e) {
e.printStackTrace();
}
System.out.println(LocalDateTime.now() + ", systemCpuLoad: " + String.format("%.2f", operatingSystemMXBean.getSystemCpuLoad()));

long sleepTime = 100 * 1_000_000L; // convert to nanoseconds
long startTime = System.nanoTime();
while ((System.nanoTime() - startTime) < sleepTime) {
}

System.out.println(LocalDateTime.now() + ", systemCpuLoad: " + String.format("%.2f", operatingSystemMXBean.getSystemCpuLoad()));
}
});

thread.start();
thread.join();
}
}

这段代码,在空闲的 1 核 CPU 的机器上执行的输出如下:

1
2
3
4
5
6
2022-02-19T11:24:57.615, systemCpuLoad: 0.00
2022-02-19T11:24:57.726, systemCpuLoad: 1.00
2022-02-19T11:25:07.735, systemCpuLoad: 0.04
2022-02-19T11:25:07.837, systemCpuLoad: 1.00
2022-02-19T11:25:17.841, systemCpuLoad: 0.04
2022-02-19T11:25:17.943, systemCpuLoad: 1.00

在空闲的 2 核 CPU 的机器上执行的输出如下:

1
2
3
4
5
6
2022-02-19T11:28:07.804, systemCpuLoad: 0.01
2022-02-19T11:28:07.904, systemCpuLoad: 0.50
2022-02-19T11:28:17.905, systemCpuLoad: 0.02
2022-02-19T11:28:18.006, systemCpuLoad: 0.50
2022-02-19T11:28:28.007, systemCpuLoad: 0.01
2022-02-19T11:28:28.108, systemCpuLoad: 0.50

在空闲的 4 核 CPU 的机器上执行的输出如下:

1
2
3
4
5
6
2022-02-19T11:31:09.925, systemCpuLoad: 0.02
2022-02-19T11:31:10.026, systemCpuLoad: 0.26
2022-02-19T11:31:20.027, systemCpuLoad: 0.03
2022-02-19T11:31:20.127, systemCpuLoad: 0.26
2022-02-19T11:31:30.128, systemCpuLoad: 0.02
2022-02-19T11:31:30.229, systemCpuLoad: 0.25

到这里已经真相大白,再看一台 2 核 CPU 的机器采集到的不正确的系统 CPU 使用率的 Grafana 监控图表:


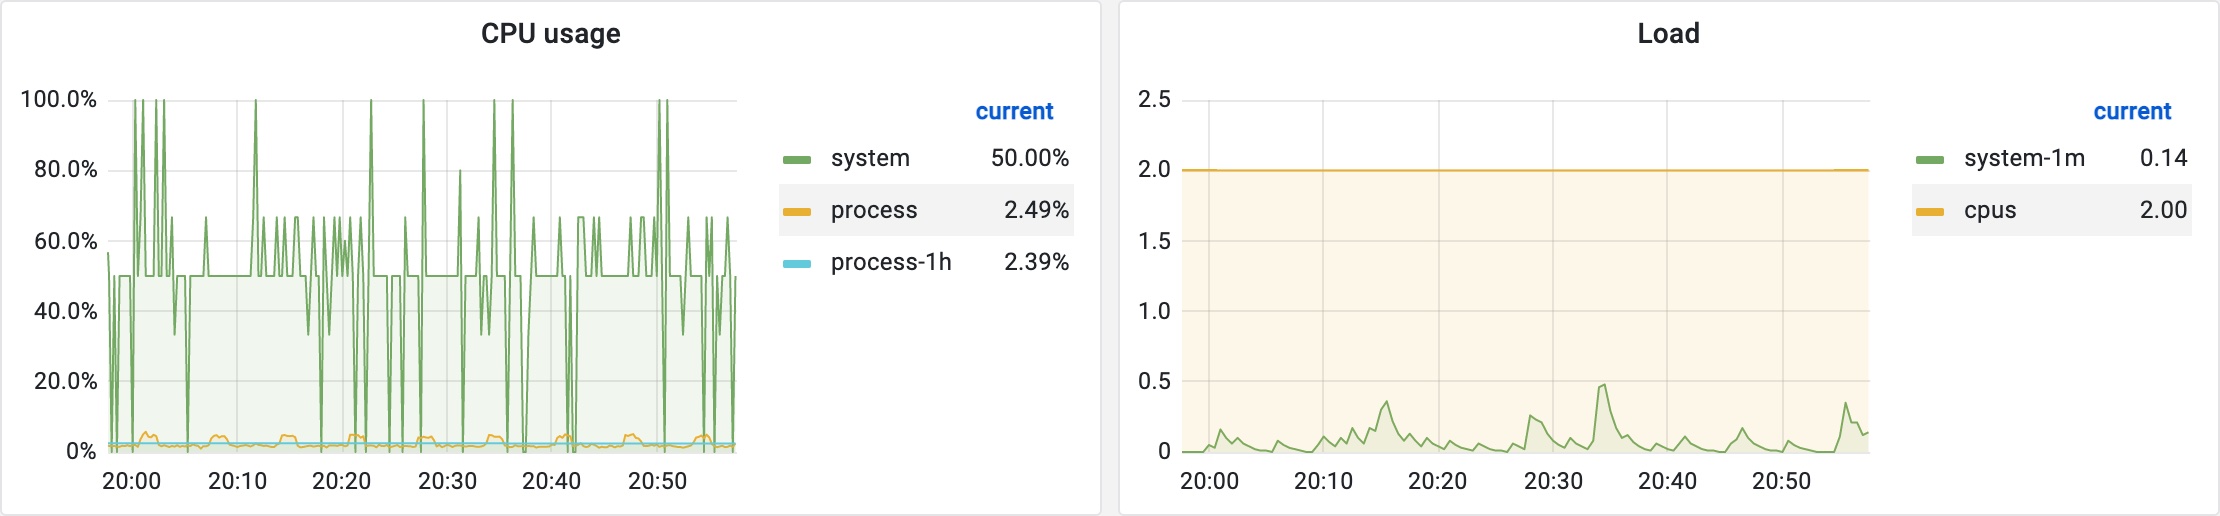
该图也印证了我们的猜想。最后我找了台系统 CPU 使用率采集值正确的机器发起了堆转储,再看看其中用于采集系统 CPU 使用率的 MicrometerCollector 实例与 JmxCollector 实例在 Node 数组中的分布顺序:


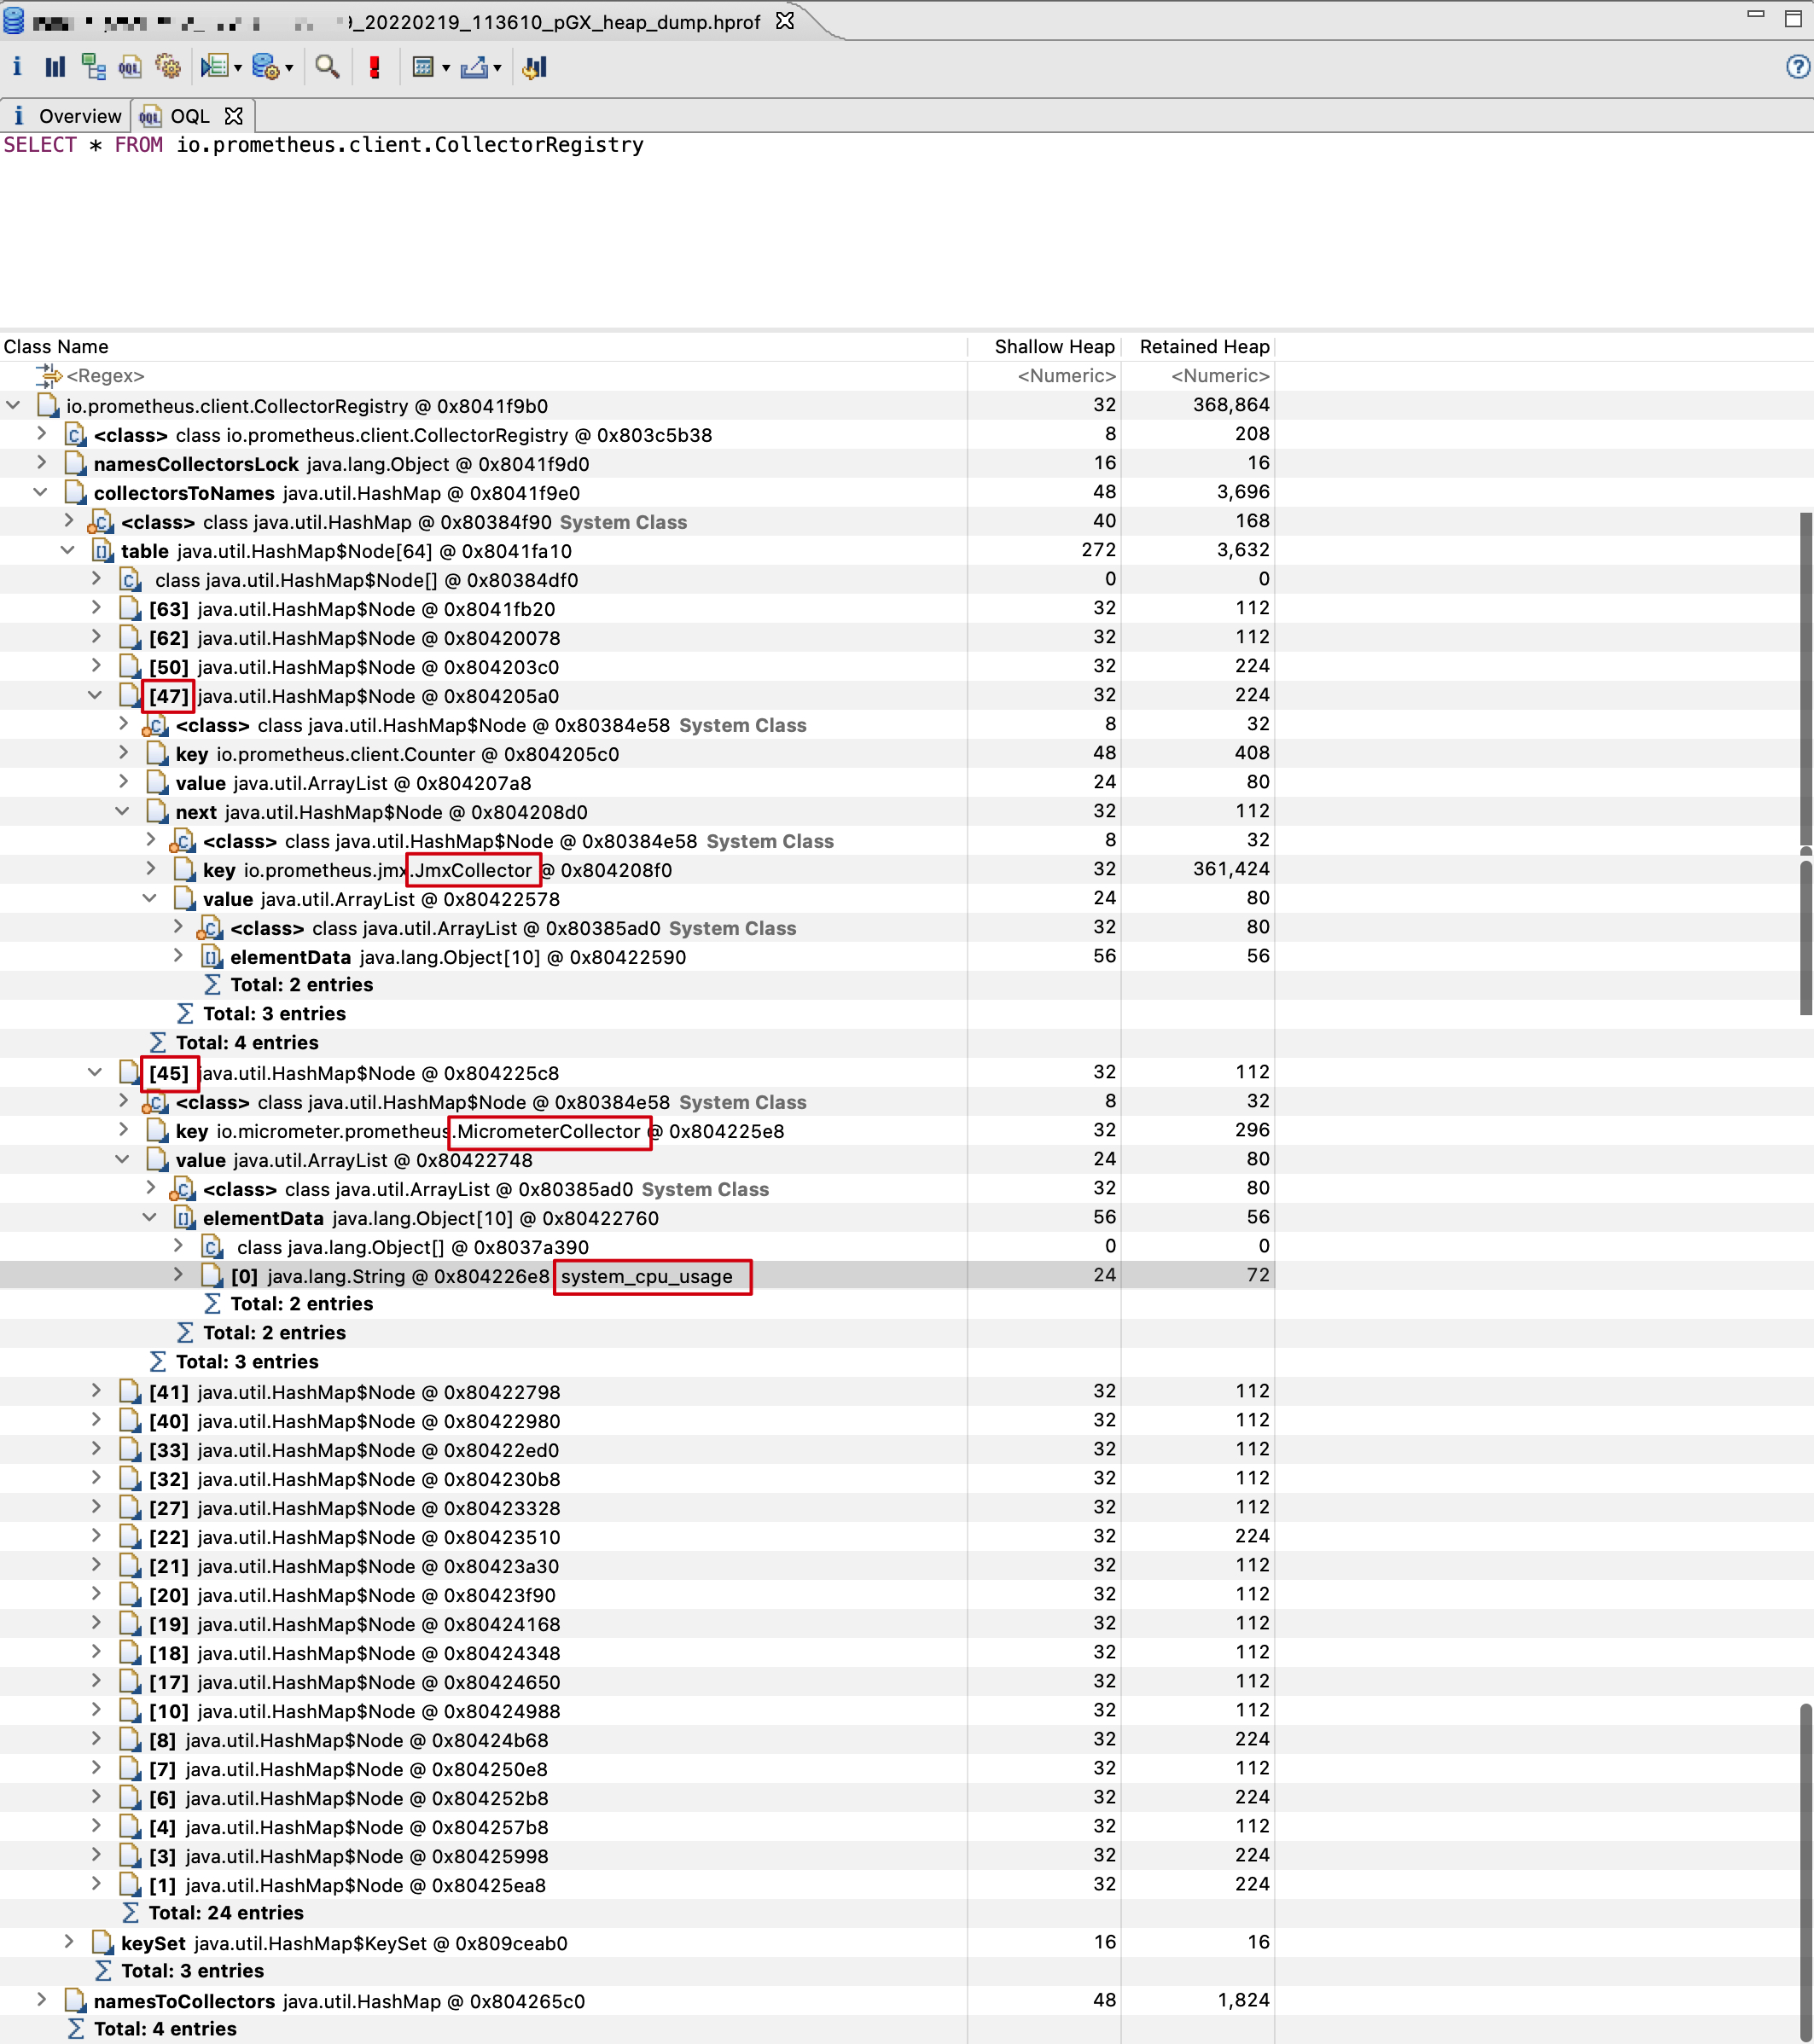
当用于采集系统 CPU 使用率的 MicrometerCollector 实例在 JmxCollector 实例之前发起采集时,此时采集时间间隔接近 10s,所以采集出的数据无误。至此,我们已经分析完了整个问题,解决方法有很多种,此处不再赘述。

Reference

proc(5) - Linux manual page
MemoryAnalyzer/OQL - Eclipsepedia