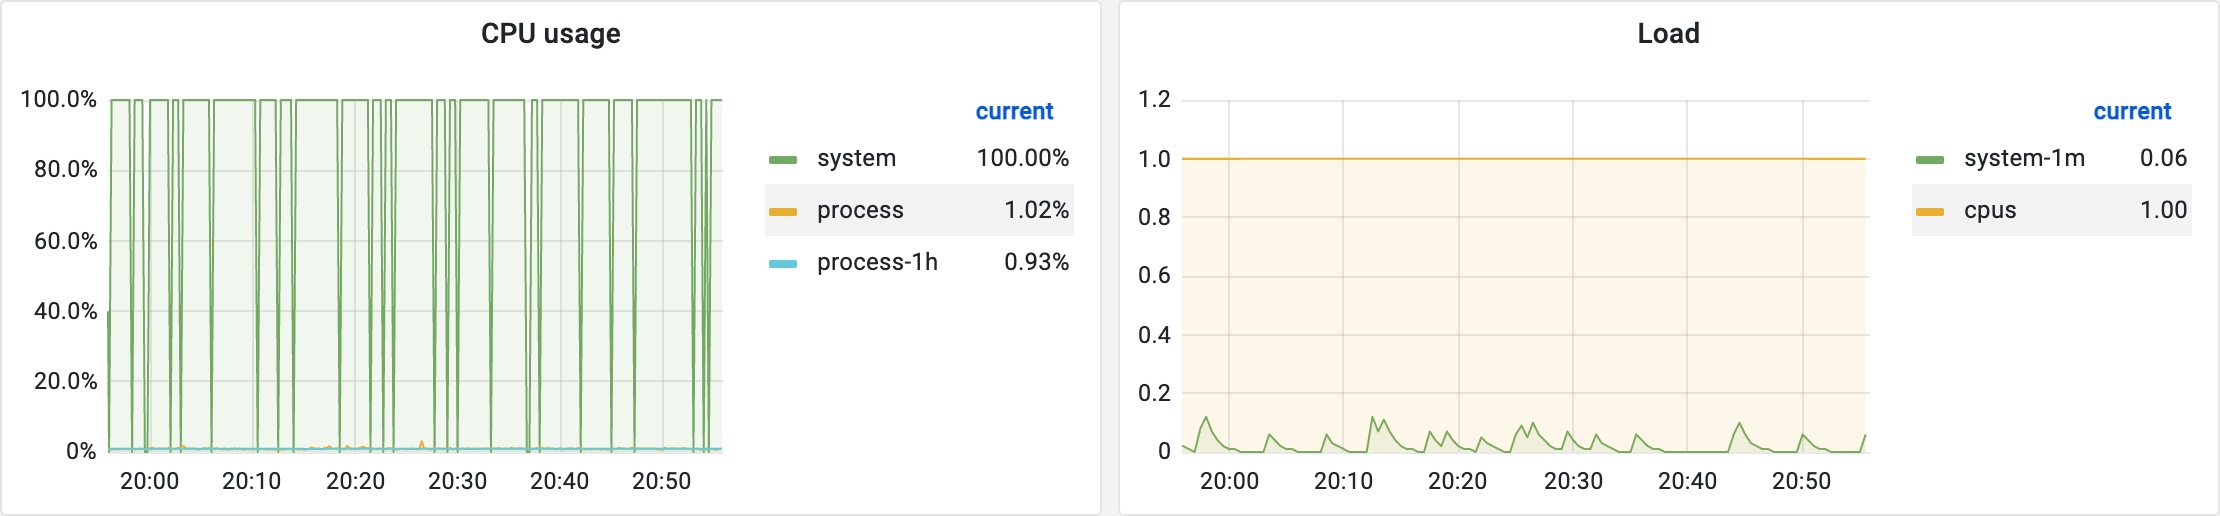
我们发现在部分实例上采集的 CPU 使用率明显不正确,出问题时采集到的值总是高于实际值,进入实例通过 top 等命令确认 CPU 使用率并不高,且有时重启应用后采集的 CPU 使用率又会正常,再次重启后可能又不正常,其中一台单核 CPU 实例的 CPU 使用率不正常时的 Grafana 监控图表如下图所示:
我们发现在部分实例上采集的 CPU 使用率明显不正确,出问题时采集到的值总是高于实际值,进入实例通过 top 等命令确认 CPU 使用率并不高,且有时重启应用后采集的 CPU 使用率又会正常,再次重启后可能又不正常,其中一台单核 CPU 实例的 CPU 使用率不正常时的 Grafana 监控图表如下图所示:
一直以为 max-age 设置的值表示本地浏览器接收到响应后从当前时刻开始计算的可存活的时间,今天查了个问题,发现并不是。根据 RFC 中的描述,max-age 表示自源站服务器端生成响应后的最大生存时间,并不是自本地浏览器接收到响应后的最大生存时间。
A response’s age can be calculated in two entirely independent ways:
- now minus date_value, if the local clock is reasonably well synchronized to the origin server’s clock. If the result is negative, the result is replaced by zero.
- age_value, if all of the caches along the response path implement HTTP/1.1.
Given that we have two independent ways to compute the age of a response when it is received, we can combine these as
corrected_received_age = max(now - date_value, age_value)and as long as we have either nearly synchronized clocks or all HTTP/1.1 paths, one gets a reliable (conservative) result.
同时发现对没有设置 Cache-Control 的资源,浏览器对部分资源进行了 If-Modified-Since 探测,而部分资源没有进行探测直接使用了本地缓存,查了下文档,原来是根据资源的 Last-Modified 距当前时间的差值来决定是否缓存一段时间,简单来说就是如果一个资源上次修改的时间已经很久了,那么我们可以认为在一定时间段内,该资源不会被修改,所以这时即使没有设置 Cache-Control,浏览器也会将该资源缓存一段时间。典型的缓存时间计算公式为 (current time - last modified time) / 10。
在之前的项目中,多数据源路由曾采用在接口上使用自定义注解指定数据源的方式实现。直到前几天,有同事反馈使用了自定义注解但是数据源切换没有生效,经过排查后,确认是多接口存在相同方法导致,简化后的部分代码如下,原 DAO 接口定义为:
1 | public interface BizDao { |
而后同事新写了个 DAO 接口并继承了 BizDao,简化后的代码如下:
1 |
|
GC 日志:
1 | 2022-01-17T13:39:14.399+0800: 920001.780: [GC pause (G1 Evacuation Pause) (young), 0.0109317 secs] |
OperatingSystemMXBean 中的 getFreePhysicalMemorySize() 方法返回的值为不含缓存的可用物理内存,该指标不能很好的反应 Linux 中实际可用的物理内存,因为 Linux 尽量使用内存的特性,该指标返回的数据几乎总是接近总物理内存,我们根据 /proc/meminfo 中返回的数据采集出类似 free 命令中 available 列的值以便更好的监测可用物理内存。